Quantcast
Channel: Nicholas Blumhardt
Viewing all 102 articles
Browse latest View live

Detecting never-before-seen event types

$
0
0

Perhaps the most useful, but seldom-noticed benefit of a structured log is having the first-class notion of an event type.

When analyzing a traditional text-based log, there’s no concrete relationship between the messages:

Pre-discount tax total calculated at $0.14
Pre-discount tax total calculated at $5.20
Customer paid using CreditCard

From a tooling perspective, each might as well be a unique block of arbitrary text. A lot of work’s required using tools like logstash to go further than that.

In a structured log from Serilog, the message template passed to the logging function is preserved along with the event. Since the first two come from the template:

Pre-discount tax total calculated at {TaxAmount}

While the third comes from:

Customer paid using {PaymentMethod}

We can use this information to unambiguously find or exclude either kind of event. It’s so simple and straightforward it is mind-boggling not to see this technique used everywhere!

Working with message templates is verbose though, so Seq produces a 32-bit (Murmur) hash of the message template that can be referred to using hex literals, for example Pre-discount tax total calculated at {TaxAmount} → $A26D9943, while Customer paid using {PaymentMethod} → $4A310040.

Seq calls this the hash the “event type”. Here’s Seq selecting all events of the first type on my test machine:

AllOfType

This was for me, actually, one of the core reasons to justify spending a bunch of time on Serilog and Seq – application logs no longer seemed like a hack or a crutch: working with “real” events that have an actual type elevates them to something that can be usefully manipulated and programmed against.

So, what else can you do with a log imbued with first-class event types?

Event types and “interestingness”

When I log into any of the Seq servers I maintain, they look much like this:

AllIsWell

All seems pretty good – nothing out of the ordinary. Well, at least in the last minute or two…?! It’s really hard looking at a small window on a large event stream to make any proactive decisions, because by definition, the interesting events are a minority.

A compromise I use often is to create a view just for “Warnings and Errors” – unfortunately, on a large stream, this view’s not so useful either: the same kinds of things show up again and again. Diligently excluding uninteresting events by type can help here, but that’s a very manual process and isn’t much fun in practice.

Seq 1.4 introduces some simple local storage for hosted apps, so as a test case for that I’ve spiked a different approach to finding “interesting” events. Using some app-local storage, why not keep track of which event types we’ve seen before, and emit an event whenever something “new” happens?

For example, in the case:

for (var i = 0; i < 10; ++i)
{
    Log.Information("The value is {Counter}", i);
}

We’d detect the event “The value is 0″ and then ignore further events with this event type (for values 1, 2, …). By keeping tabs on new events I might spot something unusual, or, I might just decide to incorporate the new event type into a counter or chart.

There’s a broader notion of “interestingness” than this of course, but for a simple example it’s still quite powerful.

First of Type

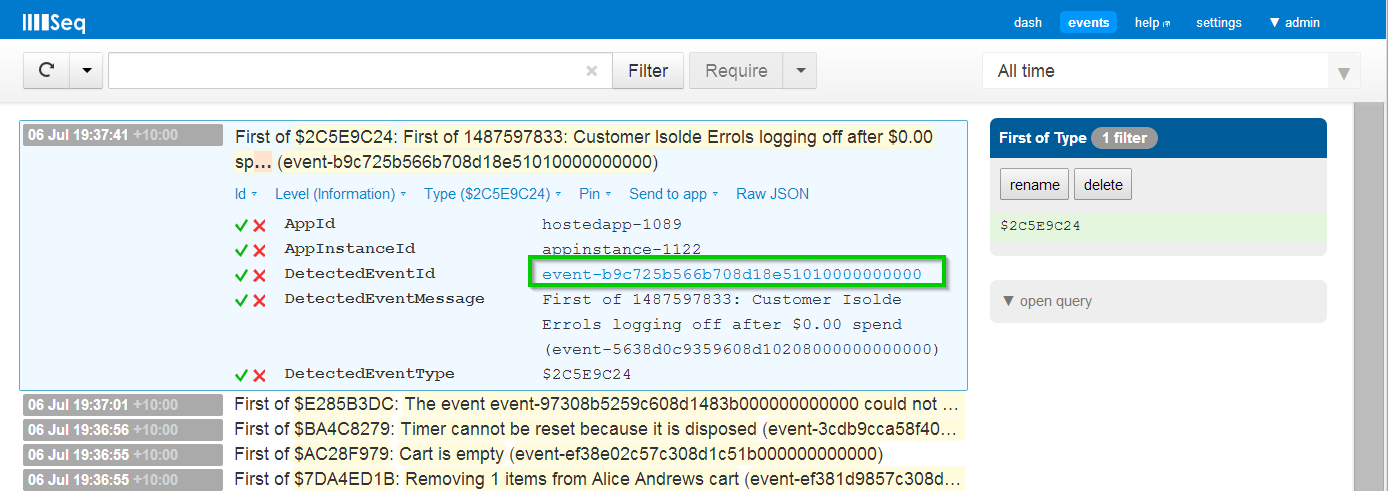
Here’s a new view on the same server shown earlier:

ViewOfEvents

Rather than list the events themselves, we see the first occurrence of each event type and a hyperlink to view the event itself (shown in the expanded property view).

This view is generated by a new Seq app “First of Type”:

NuGetOrg

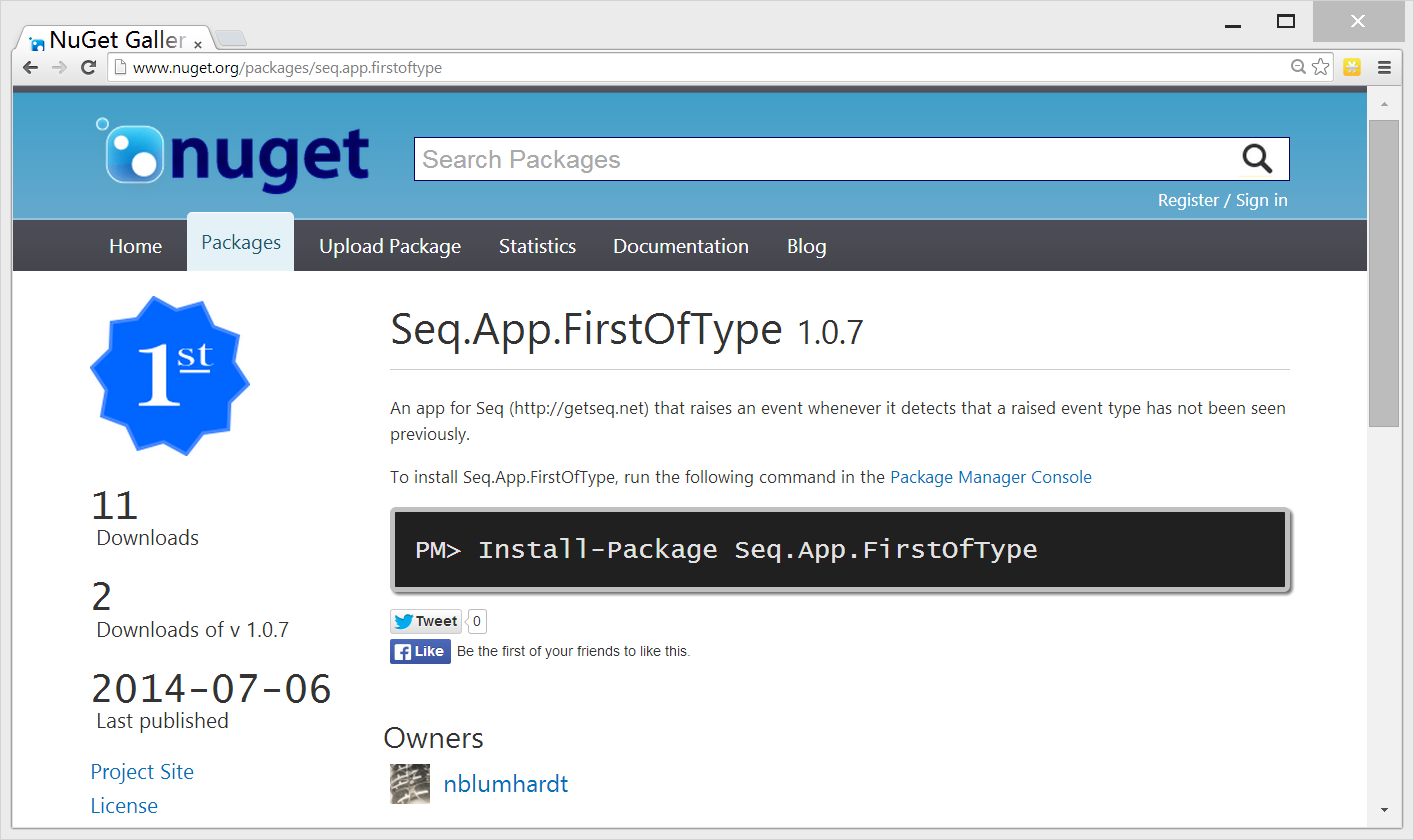
You can see the complete implementation with a few small improvements on GitHub, and install it into the Seq 1.4.4-pre build or later using the ID Seq.App.FirstOfType.

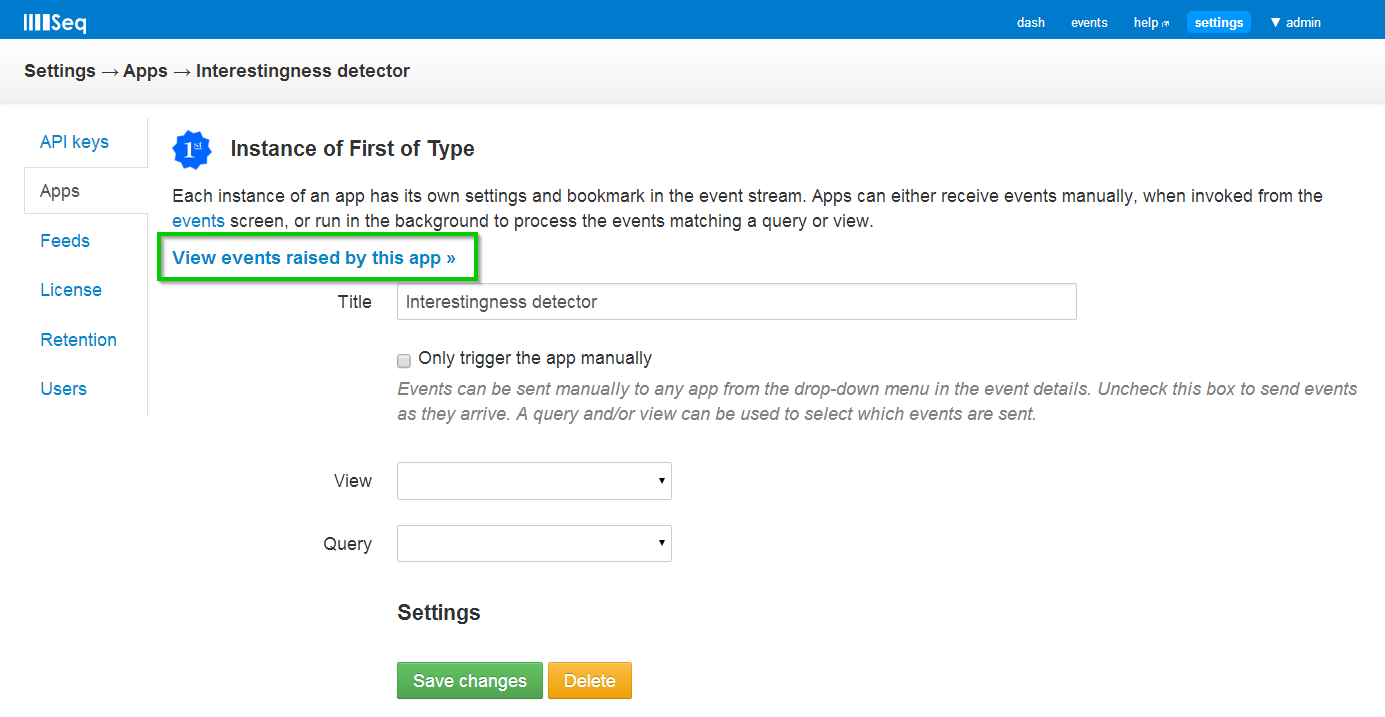
Once you’ve installed the app into your Seq server, “start a new instance of the app” that automatically accepts events, and click through to see the stream generated:

ClickThroughToEvents

(You may need to wait for 30 seconds before the new app starts getting events: Seq uses a short buffer to sort events on arrival so that they are processed in timestamp-order).

So how’s it done?

The reactor implementation:

public void On(Event<LogEventData> evt)
{

    var stateFile = Path.Combine(StoragePath, StateFilename);
    if (_filter == null)
    {
        if (File.Exists(stateFile))
            _filter = new UInt32BloomFilter(File.ReadAllBytes(stateFile));
        else
            _filter = new UInt32BloomFilter();
    }

    if (!_filter.MayContain(evt.EventType))
    {
        Log.Information("First of {DetectedEventType}: {DetectedEventMessage} ({DetectedEventId})",
            "$" + evt.EventType.ToString("X8"),
            evt.Data.RenderedMessage,
            evt.Id);

        _filter.Add(evt.EventType);

        File.WriteAllBytes(stateFile, _filter.Bytes);
    }
}

The new feature that enables this is the StoragePath property, which simply provides a unique filesystem folder for the running app instance:

    var stateFile = Path.Combine(StoragePath, StateFilename);

To keep runtime performance of the app and the size of the state file constant, we use a Bloom filter to track which event types we’ve seen:

            _filter = new UInt32BloomFilter(File.ReadAllBytes(stateFile));

The spike of the app as currently written uses a slightly smaller filter, and fewer hashes than desirable – if anyone’s interested in “doing the math” and setting up a better filter, PRs are accepted for this!

The language of the Bloom filter’s API – “may contain”, stresses that an approximation is being used:

    if (!_filter.MayContain(evt.EventType))

This does mean that new types can be missed. Tuning the filter can bring this down to a negligible percentage.

The app emits an event using Log:

        Log.Information("First of {DetectedEventType}: {DetectedEventMessage} ({DetectedEventId})",
            "$" + evt.EventType.ToString("X8"),
            evt.Data.RenderedMessage,
            evt.Id);

We don’t have to do anything special to get evt.Id hyperlinked in the Seq UI – the UI’s smart enough to detect this.

The rest of the app simply maintains the state file as event types are seen.

What’s Next?

I’ve often written log messages thinking “well, if I ever see this message I’ll know there’s a bug” – using this app there’s actually the possibility that I might notice a needle in the haystack!

It’s not a big leap from here to imagine a similar app that could track property values on an event type, either testing for uniqueness or observing variance from an historical range. Having local storage within Seq apps opens up a lot of possibilities I hadn’t given much thought to in the past. Happy hacking! :)

Using attributes to control destructuring in Serilog

$
0
0

Serilog’s often used to log out objects as structured data. For example:

log.Information("Executing {@Command}...", cmd);

will attach a structured Command property to the event that can later be queried or processed.

Sometimes we don’t want all of the properties of an object included. Where cmd is, say, a LoginCommand:

public class LoginCommand
{
    public string Username { get; set; }

    public string Password { get; set; }

    public bool RememberMe { get; set; }
}

We’d like to log the username attached to the command, but not the password. The same situation arises with credit card numbers and other sensitive information. Without some care we’ll end up logging events like:

{
  "Level": "Information",
  "Timestamp": "2014-07-18T12:30+10:00",
  "RenderedMessage": "Executing LoginCommand {Username: \"nick\", Password: \"Pa$$w0rd\", RememberMe: true}"
  "MessageTemplate": "Executing {@Command}...",
  "Properties":
  {
    "Command":
    {
      "Username": "nick",
      "Password": "Pa$$w0rd",
      "RememberMe": true
    }
  }
}

No one likes to see their password in a log file.

Classically, the way to approach this in Serilog has been to customize the destructuring policy for the command type:

var log = new LoggerConfiguration()
    .WriteTo.ColoredConsole()
    .Destructure.ByTransforming<LoginCommand>(
        cmd => new { cmd.Username, cmd.RememberMe })
    .CreateLogger();

The problem with this approach is pretty obvious — it centralizes destructuring information in a way that might not always co-operate with assembly dependencies and so-on, and gets cluttered as more types need customization.

Why ‘destructuring’ anyway?

Here’s a chance to explain one of the more unusual pieces of terminology in Serilog. The name Serilog is derived from serializing logger, and destructuring pretty much equates with serialization, so why not call it that?

The original design for Serilog was going to tackle the problem we’re observing here using a syntax like this:

log.Information("Executing {@Command(Username,RememberMe)}...", cmd);

This would have the same effect as the configuration we just looked at, selecting just the Username and RememberMe properties from the command object, but doesn’t suffer the same “centralization” issues.

This style of describing “what you want” is actually implemented in some programming languages with a feature called destructuring assignment. Hence, the name! It’s not likely that we’ll add this feature to Serilog now; a more familiar way to achieve the same result is to use attributes, as we’ll see next.

Destructuring with attributes

Fresh off the press, here’s the new solution enabled using the Serilog.Extras.Attributed package:

public class LoginCommand
{
    public string Username { get; set; }

    [NotLogged]
    public string Password { get; set; }

    public bool RememberMe { get; set; }
}

Nice and simple, huh? The NotLogged attribute simply marks properties to ignore.

Enabling this feature, after installing the NuGet package mentioned above, is as simple as calling the UsingAttributes() extension method at configuration time:

var log = new LoggerConfiguration()
    .WriteTo.ColoredConsole()
    .Destructure.UsingAttributes()
    .CreateLogger();

Other goodies in Serilog.Extras.Attributed

There’s one other little thing that you might find handy in this package. Some types, while they’re “complex data” in some sense, don’t serialize well for storage in events. These types need to be treated like scalar values (int, string and so-on) or by conversion with ToString() before logging.

You can force this behavior using the LogAsScalar attribute; here’s an example that appears in Seq:

public class Filter
{
    public string SourceText { get; set; }

    [LogAsScalar]
    public Expression<Func<Event,bool>> FilterExpression { get; set; }
}

Without LogAsScalar, the FilterExpression would be serialized as a (potentially) large tree-shaped object, that while interesting, isn’t valuable in a log. Using the attribute let’s us keep the property in the log, but use its more friendly ToString() representation.

Go get it! :)

Seq update – monthly subscriptions, updated tiers, full-featured single-user license

$
0
0

TL;DR: Seq 1.4 is out, and with it we’re fine tuning the licensing options.

Building a software product is a continual exercise in listening, learning and adapting. Since releasing v1.0 of Seq nearly five months ago, we’ve watched keenly as customers put it to work and to be frank, we now have a much better understanding of how Seq fits in to the tooling landscape.

Part of this learning has shown us how customers fit Seq into their own environments, including how those environments dictate licensing requirements. Feedback has highlighted some discrepancies between how we license Seq and how it’s used, so for the past month we’ve been working on a revision to our model.

First, two important things:

  • If you’re using Seq today, you don’t need to change anything – the license you use Seq under is unchanged unless you upgrade to a newer version (outside of the one-year included upgrades period)
  • If you’re worse off under the new model, or have questions/suggestions please email support@getseq.net – we will help you across

Changes to our free tier

The challenge with licensing is to make a fair cost/benefit proposal: Seq should be less expensive to use when the benefit is less and when the effort in supporting it is less. When the benefit is greater, or when the support requirements are greater, asking more helps us to provide the level of service required.

Unfortunately, the unlimited-usage “Developer Edition” we launched with thwarts this requirement – how much Seq costs to use ended up coming down to whether the production environment was fully-secured or not. In a production environment secured by other means (e.g. a VPN or other network-level security) the price to use Seq might be zero (via the “Developer Edition”), while a small difference in network topology might require the top-level “Enterprise Edition” for the exact same use of Seq – that is, the exact same benefit.

To fix this, we’ve bitten the bullet and decided to license Seq purely on a per-user basis. The old Developer Edition has been replaced with a new, fully-securable Single-User license. Many, if not most, customers using the old Developer Edition will be able to switch to the new Single-User license and take advantage of authentication and SSL to put Seq in more places.

Register to receive your single-user license key

No model is perfect, but we think setting the price on the basis of the number of users is a much better measure of both how much value Seq will provide, and how much support/development we will need to sustain to make the best experience possible. Basing this on whether or not authentication is required was a mistake on our part.

Some teams will be using the old Developer Edition with more than one user, so won’t be able to take advantage of the new Single-User license. If you’re in this position, and can’t switch to one of our subscriptions or per-user tiers, get in touch – supporting you is important to us and we’ll help you across so that you can continue to benefit from new Seq releases.

New per-user tiers

Previously we supplied Seq in five, fifteen and twenty-five user tiers. There turns out to be a big difference between a six-user team and a fourteen-user one, so the new model is more fine-grained, providing five-user increments from 5 all the way to 25 users.

See the new pricing tiers

Three server installations with all tiers

Perhaps more importantly, Seq previously included a single server installation with each of the five- and fifteen-user tiers. It turns out that this penalised users with segregated environments: if “Dev” and “Test” are on-premises, but “Prod” in the cloud, requiring two licenses seems fairly arbitrary – where an environment is situated shouldn’t make such a big impact on pricing.

In the new model, each tier includes three Seq servers. This means a single license should cover most teams regardless of how their environments are organised.

New unlimited-user Enterprise license

In Enterprise environments, counting seats can be annoying and lead to more time spent in the purchasing process as teams change size and shift focus. For Enterprise customers we’re now offering an unlimited-user license, installable on up to ten servers, to make life simpler.

We’re also looking at ways to make an Enterprise SLA available alongside this option – please get in touch via sales@getseq.net if this is needed in your organization.

Subscription pricing

Along with our up-front pricing, we’re now offering Seq on a pay-as-you go basis for those who’d rather pay by the month. We’re making this available primarily as a convenience – the product you get is exactly the same, i.e. you will still host Seq on your own servers.

Subscriptions come with full email support and access to all upgrades during the subscription period.

Subscribe now!

We’re counting on your feedback

We count on your feedback to make Seq a better product and to make it accessible no matter your needs; if you have suggestions, queries or concerns we’d love it if you can email us.

Seq and Serilog around the web – August

$
0
0

Things have been quiet on my blog for the last few months, but certainly lively elsewhere around the web. I thought I’d post a few pointers to what’s new in the worlds of Seq and Serilog.

Hey— I’ve started cross-posting anything related to Seq on the Seq blog; this (nblumhardt.com) site will continue as my personal blog with a bit more varied material including most Seq content for now, so stay tuned in!

Modern Structured Logging with Serilog and Seq

If you or your company has a Pluralsight subscription, make sure you check out the great Modern Structured Logging with Serilog and Seq course written and presented by Jason Roberts.

The first two major sections of the course give a deep introduction to structured logging and Serilog, while the third section introduces Seq; the course is worth watching for either or both.

If you’re championing structured logging in your organisation, Jason’s course would make a great way to bring others up to speed.

Improve and Repeat

Johnny Graber’s Improve and Repeat blog is featuring Serilog in a series on modern structured logging. The first two instalments are up:

  1. The Missed Opportunities of Log Files
  2. Structured Logging with Serilog

It’s shaping up to be another good resource for teams starting to introduce structured logging.

If your team still needs convincing that learning about Serilog is worth their time, Kristoffer Jansson’s Why You Should Try Out Serilog should help.

Event-processing angles

I thought it was cool to see this sample from the XSockets.NET team showing how to connect to a running (Serilog-enabled) application to collect logs.

Unlike other sinks we’ve seen to date, in this case the sink is a server, and clients connecting via XSockets request the level of log events they wish to be sent. It’s a really exciting angle that I think deserves serious exploration (think on-demand real-time diagnostics…)

Tangentially related (since we’re talking event processing here :)) Daniel Little posted a nice little primer on Debugging Rx with Seq, which is a pretty imaginative use for it.

Site redesigns!

Both Serilog and Seq themselves got new websites in the last couple of months.

Serilog is now an eye-catching red design:

Serilog.net

I’m really happy with the way this one turned out – it’s nice and simple, and keeps all of the important info (how to use Serilog; where to find documentation and so-on) front-and-center.

Seq now has a new layout that makes it easier to organize content:

GetSeq.net

Currently the biggest improvement, other than the livelier design, is better access to older versions and release notes via the improved Downloads area. It’s also nice to have complete setup instructions back on the front page to show just how easy it is to get started.

What have I missed?

Let me know :)

Seq 1.5 preview

$
0
0

TL;DR: The next point release of Seq is a bit broader in scope than what we’ve shipped in previous point releases. Storage and caching changes in Seq 1.5 bring some noticeable improvements to performance, responsiveness and manageability.

Since Seq first arrived a year ago, its storage has been a simple b-tree based data file managed by ESENT. This had pros as well as cons: on the pro-side, we’ve been able to keep our efforts focused on making Seq quick to set up and easy to use while ESENT does its thing keeping data safe and accessible on disk.

This approach has taken us a long way, but coupled with the particular access patterns generated by log data, it does lead us to some cons, the biggest of which we’re addressing in Seq 1.5.

Query performance and cache efficiency

In Seq 1.4, we left caching decisions to ESENT – what to cache, when to expire it, and how much RAM to use in the process. For the most part this did a fine job, but it left a couple of important opportunities on the table.

Segmented caching

Log data has a very specific access pattern: recent events are always more interesting than historical ones. A couple of queries deep into history shouldn’t cause more recent events to be purged from cache. Recently-written events should get to the cache before needing queries to “warm them up” and so-on.

In 1.5, Seq keeps a time-ordered list of cached event segments. Each segment is a time slice – the preview uses 1-day slices as the unit of granularity. As RAM fills up, segments are dropped from the end of the list, preserving more recent events.

Cache

It’s a very simple strategy, but an effective one – response times on queries improve dramatically when all data is in cache, and most queries of interest are filled by recent events.

Naturally, response time drops as the query progresses into un-cached regions of storage. Our current “usability benchmark” is to consider a million 1 KB events generated per day. On a 16 GB server, around a week’s data will be cacheable, and response time on this will be within a few seconds. Most Seq installations carry a lot fewer events and so will run completely in RAM.

Past the cache bounds, “archival” data is available at a response time a couple of orders of magnitude below this. Optimally, a retention policy will thin out the events past this point, e.g. by deleting “debug” or tracing events, thus bringing response times back up within a similar range.

Optimal in-memory representation

Using the storage layer’s cache meant Seq still had quite a bit of work to do when scanning events to fulfil query results. This work not only added to response time – it also generated garbage that pushed the GC harder, reducing overall performance.

Since we’re now in control of our own caching destiny, in Seq 1.5 we’re free to choose an in-memory representation that’s much closer to our needs when querying. This eliminates all JSON processing and allocation on a per-event basis, and makes it possible to run practically all queries in compiled code.

Schema-sharing

The most exciting outcome of choosing our own in-memory representation is the opportunity we then have to extract common features from events.

When caching raw event data at the storage layer, each “blob” is unique – property names and so-on get stored for every event. If two events are created by the same line of code, thus having the same property names and message template, the storage layer will record two copies of this information.

In RAM, we’re free to share schema information and duplicated values between many events. While the following two events share nothing on disk:

{"Latitude": 25, "Longitude": 134}
{"Latitude": 12, "Longitude": 54}

In the Seq caching layer they’ll share a single schema object:

Schema

Over many events the savings brought by this approach are significant.

Manageability

Using a single, large data file brought with it a couple of major drawbacks.

Sheer size

First, storing everything in a single large file makes it hard to work with large Seq installations. One user ended up with a single 350 GB default.seq that was impossible to work with in any way. We don’t want to see that again!

In Seq 1.5, files on disk are split into 7-day extents:

Storage

The extents are completely self-contained, meaning they can be deleted, moved or backed-up individually.

Compaction time

ESENT data files can only be compacted (shrunk to remove free space) off-line. Coupled with creating a very large data file, this could mean considerable downtime while disk space was reclaimed, and having to use command-line tools to do it was inconvenient.

Compaction would also require enough free disk space to hold a complete copy of the data – a challenge and a waste when a lot of event data is stored.

Using a series of extents on disk means that segments can be compacted one at a time, ideally in the background on a running server, and only the storage for a single extent is required during the compaction process.

The 1.5.5-pre build still relies on a command-line seq compact facility, but storage requirements are lessened and the process is much more responsive. We’ll be working on background compaction for the next preview.

Installing Seq 1.5.5-pre

There are a few things to know before you upgrade to Seq 1.5.5-pre.

The migration process requires approximately the same disk space as is taken by the existing C:\ProgramData\Seq\Data folder. Seq will refuse to migrate or run without this available. After migration is run, the space will be freed and won’t be needed again except to store events.

Running the following commands prior to migration will free as much space as possible for the process:

seq stop
seq compact

Migration from a large Seq 1.4 database can also take considerable time – allowing 10 minutes per million events would give a safe margin; better hardware will move data much faster. If this makes migration prohibitive, and you can’t use retention policies to cut down on event volume beforehand, please email support for help.

After migration completes, it will take a little while for the cache to warm up. If you see an asterisk (*) after the Loading… indicator text, this means events are being scanned in un-cached storage regions. Give it a few more minutes :).

Finally, the new cache is designed for server use and thus consumes as much system memory as it can. If the system comes under memory pressure, it will release memory to compensate. This mightn’t be convenient on all systems – if you’re in this position we’d like to know a bit more about your setup: email us at the address above and we’ll let you know when configuration options are available to control this.

What else is to come from 1.5?

Already included in the current preview are some major improvements to start-up/shut-down time, and some long overdue features such as manual deletion of events. There are several other tickets planned for the full release, and I’ll post some details on those as they land.

How does 1.5.5-pre work for you?

We haven’t published any figures with this post; when Seq 1.5 is ready to ship I’ll make sure we share some 1.4 vs. 1.5 benchmarks, but for the time being we’re looking for real-world usage and feedback to validate the direction we’re taking and provide a qualitative measure of how the changes stack up.

If you’re able to try Seq 1.5, we’d love to hear your impressions. It’s not a production-ready release, but we’ll do our very best to support migration from the preview to RTW when that happens (we’ve migrated our own servers!) so with some small risk it should be fine to use on dev/non-mission-critical systems.

Download it now!

You can grab the installer here.

How (not) to parameterize Serilog events

$
0
0

Writing an event with Serilog is just like formatting a string:

Log.Information("The time is {Time}", DateTime.Now);

There’s one subtle and important difference though. The first parameter to Information(), here given the value "The time is {Time}" isn’t just an arbitrary string – it’s a Serilog message template.

You might be tempted occasionally to write events like:

Log.Information("The time is " + DateTime.Now);

Don’t do this. While never particularly good logging practise (the string concatenation occurs regardless of whether logging is enabled or not, wasting RAM and CPU cycles), with Serilog this is strongly considered an anti-pattern.

Why an anti-pattern?

The first example, using Serilog correctly, creates events that are logically like:

{
  "MessageTemplate": "The time is {Time}",
  "Properties": { "Time": "2014-09-11T09:35.55.000" }
}

The second, incorrect example will yield:

{
  "MessageTemplate": "The time is 2014-09-11T09:35.55.000",
  "Properties": {}
}

While you might not notice the difference initially when logging to the console or a text file, the first event is much more useful than the second:

  • Time is stored as a queryable property
  • All events of this type share the same message template, making the events queryable by type as well

Serilog is also optimised for creating well-formed events like the first one; while the second example won’t blow up, since each event has a unique “template” it will not take advantage of message template caching, requiring the message to be parsed each time. The extra junk in the message template cache will eventually cause the cache to flush, reducing logging performance throughout the app.

Be on the lookout…

There are a few ways your code can fall into this trap. Here’s (a simplification of) one that got me recently:

catch (Exception ex)
{
  Log.Error(ex.Message);
}

It’s a bit harder to spot the logging of an arbitrary string here, but like the broken example above, this will generate a potentially-unique template for every message.

(In case you’re wondering, the recommended way to log an exception with Serilog is:

catch (Exception ex)
{
  Log.Error(ex, "Failed while trying to open the database");
}

The exception will be attached to the event as a first-class property, and fully-rendered in both text and JSON… Easy!)

Event = Template + Properties

Just remember, a Serilog event isn’t a string – it’s the combination of a message template and zero-or-more properties.

Thinking this way will help you get more value out of Serilog as your application grows and you start to consider more advanced storage/querying options. Happy logging!

Querying collection properties in Seq 1.5

$
0
0

Seq implements a filtering syntax that’s loosely based on C#. The following expression matches the events you’d expect it to, if you’re used to working with C# or a similar language:

Tag == "seq"

Which is to say: “Match events where the Tag property has the value "seq". Sub-properties of objects can be accessed using the familiar dotted syntax (Property.Subproperty.Subproperty) and so-on.

Seq 1.5, currently a preview, steps into some new territory.

What about a collection of tags?

It’s not uncommon for Serilog events to carry properties that are collections. For example we might log events on a Q&A site like:

Log.Information("User {Username} posted a question tagged {Tags}", username, tags);

Resulting in events like:

Event with Collection Property

Instead of being marked with a single tag, each event carries a collection of zero-or-more.

Matt Hamilton asks:

This is where Seq 1.4 draws a blank. Translating this to the Q&A example, about the best we can manage is a text search for "seq" and requiring the existence of the Tags property using Has(Tags).

This is a bit of a shame – the promise of Seq and structured logging in general is to make querying log events precise – so why aren’t collections covered?

The C# way

Seq isn’t only about precise queries; the whole foundation of the app is the idea that it should also be easy and natural to query log data.

I’d thought about collection queries quite a lot when putting the original filtering syntax together. C#-style the query would look something like:

Any(Tags, tag => tag == "seq")

Seq doesn’t use extension method-style calls, but this is pretty close to the Enumerable.Any() call you’d write using Linq.

I don’t like it!

In a full-featured programming language this syntax makes sense, but it’s too noisy, complex, and easy to mistype to make a good filtering syntax for Seq. And so, that’s where things have sat for the last twelve months.

Pattern matching

With a bit more thought, Matt and I both ended up thinking the problem might be better suited to a pattern-matching syntax like:

Tags[?] == "seq"

So, this is what Seq 1.5 provides. The question mark wildcard ? matches any element in the collection, while an asterisk * wildcard only matches if all elements satisfy the condition.

Questions tagged seq

Wildcards work in any comparison where one side is a property path (including indexers and dotted sub-properties). Multiple wildcards along the path are supported.

You can write the following expression to find questions where all answers are "Yes!":

Answers[*].Content == "Yes!"

(Under the hood, Seq rewrites these expressions into the equivalent lambda-style syntax – much the same way as the C# compiler transforms Linq query comprehensions. Working through implementing this reminded me just how fantastic the C# compiler really is!)

Try it out!

You can download a preview build of Seq 1.5 here. It’s not ready for production use yet, but should be just fine for dev/non-mission-critical servers. We’d love to hear what you think!

Dynamically changing the Serilog level

$
0
0

In the Serilog project we’re frequently asked how to adjust the logging level at runtime, and until recently we haven’t had a great answer.

Many larger/distributed apps need to run at a fairly restricted level of logging, say, Information (my preference) or Warning, and only turn up the instrumentation to Debug or Verbose when a problem has been detected and the overhead of collecting a bit more data is justified.

Setting the level to its minimum (Verbose) and dynamically filtering events has been our suggestion so far, and it does save on network or disk I/O bandwidth, but the overhead of generating the events in the first place is still a significant consideration.

In Serilog 1.4.11, there’s a new type, LoggingLevelSwitch that provides this feature with very minimal performance overhead.

Using LoggingLevelSwitch

If an app needs dynamic level switching, the first thing to create is an instance of this type:

var levelSwitch = new LoggingLevelSwitch();

You need to keep the switch around in an accessible place.

This object defaults the current minimum level to Information, so if you want to be more restricted, set its minimum level up-front:

levelSwitch.MinimumLevel = LogEventLevel.Warning;

Now, when configuring the logger, provide the switch using MinimumLevel.ControlledBy():

var log = new LoggerConfiguration()
  .MinimumLevel.ControlledBy(levelSwitch)
  .WriteTo.ColoredConsole()
  .CreateLogger();

Now, events written to the logger will be filtered according to the switch’s MinimumLevel property.

If you need to turn the level up or down at runtime, perhaps in response to a command sent over the network, it’s as easy as:

levelSwitch.MinimumLevel = LogEventLevel.Verbose;

log.Verbose("This will now be logged");

Viewing logs from C# mobile apps

$
0
0

I’ve recently been writing some code for Windows Phone, cross-compiled for iOS and Android using the Xamarin tools.

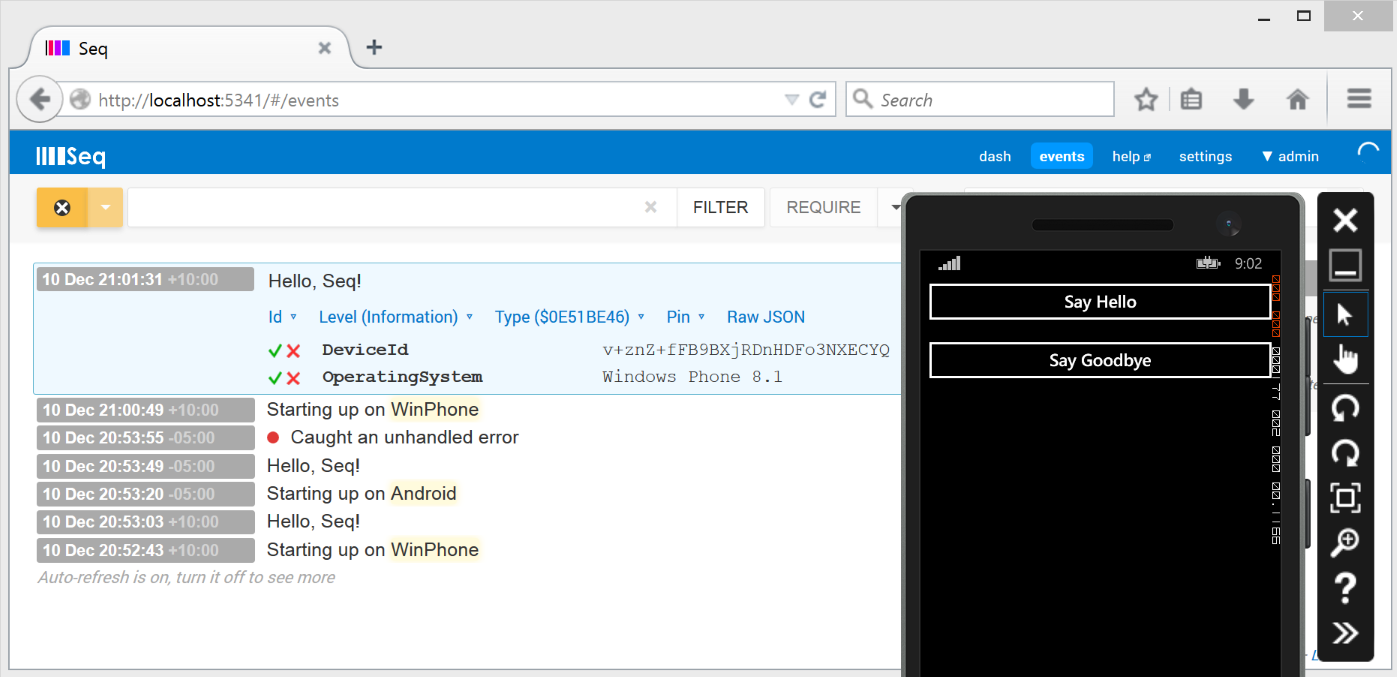
The app does quite a lot of background processing, but during development and testing it started to feel like a black box. A few lines of code got events posting from Serilog via HTTP to a Seq instance running on my development machine.

I liked the results so much tonight I decided make a quick experimental port of Serilog.Sinks.Seq to a portable class library:

Seq.Client.Portable

You can install it in your Windows Phone or Xamarin project directly from NuGet:

Install-Package Seq.Client.Portable

Configure the logger in portable code:

Log.Logger = new LoggerConfiguration()
  .WriteTo.SeqPortable("http://169.254.80.80:5341")
  .CreateLogger();

And write log messages from your mobile app straight back to Seq running on your development machine:

Log.Information("Hello, Seq!");

Single-user installs of Seq are free, so you can use this during development even if your team uses something else for production logging.

Emulator Networking

You’ll need to use the address of your development machine assigned by the emulator – don’t try connecting to Seq as localhost – this will loop back to the emulator itself. Windows Phone lets me get at my desktop via "http://169.254.80.80:5341" while Android works with "http://10.0.2.2:5341". (5341 is the default port Seq listens on.)

I haven’t tested this on iOS yet – it’s possible you’ll find issues there if you beat me to it.

Why ‘Experimental’?

It’s somewhat uncharted territory for me – Serilog is still working the last kinks out of iOS/Android support, and the Serilog features that the sink relies on aren’t all portable because of missing features like System.Threading.Timer. Eventually I hope the code here can be feed back into Serilog and improve this.

Where’s the code?

Here, on GitHub. Please send a PR if you find any improvements to make. Enjoy!

Uncorking the Seq API

$
0
0

The web interface of Seq connects to the server via a simple API using JSON/HTTP. (I’d call it REST, but it’s not fully IEEE 1337.00 REST-1.1 compliant ;-))

Quite a few customers integrate with the API, either for querying events or for automating administrative tasks like adding users, creating/modifying queries and views, etc.

Though it’s possible to just jump right in using JSON, it’s a pain to figure out the dynamic structure of the entities that are sent and received and hand-code C# types that serialize appropriately using JSON.NET.

To fix this, we just published the entire set of Seq API types, as well as higher-level wrappers, to the new seq-api project on GitHub and published via NuGet:

Install-Package Seq.Api

You can use the package to connect and work with items from your Seq instance:

var connection = new SeqConnection("http://my-seq/prd");

var views = await connection.Views.ListAsync();
foreach (var view in views)
{
  Console.WriteLine(view.Title);
}

Things should be pretty self-explanatory – just dot your way through the properties on SeqConnection to find your way around.

As a brand new project we fully expect some rough edges in there, for example you may need to upgrade to Seq 1.6.7 in order for some features to work. You can already do some interesting things with it though!

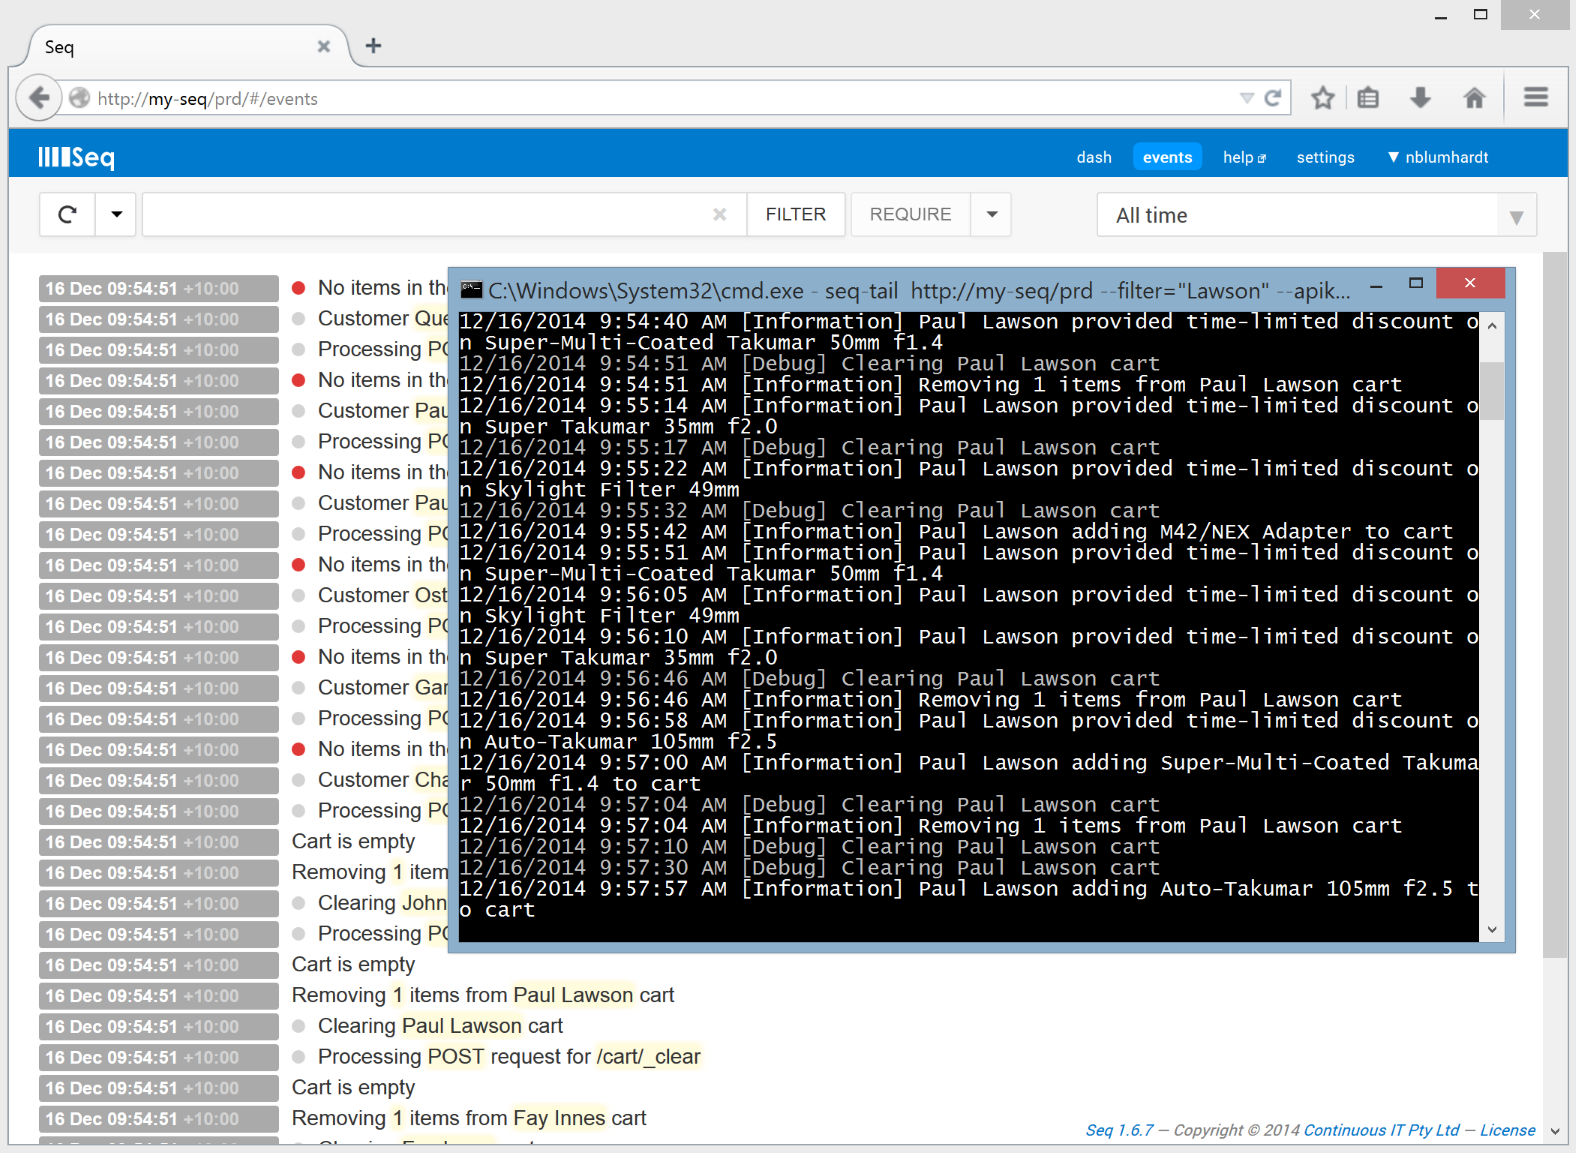
The seq-tail.exe app that’s included as a sample in the repository implements something like the Unix tail for logs from your remote Seq server.

seq-tail

Syntax is:

seq-tail.exe <server> [--filter=<f>] [--apikey=<k>] [--window=<w>]

(Nerdy note – if you haven’t seen docopt.net in action before, check out how the command-line parsing in the example works.)

Now that the API is published I’m looking forward to actively improving it – it’s crying out for some Rx love, for starters. If you crank it up I’d love to hear about your experiences.

Give your instrumentation some love in 2015!

$
0
0

This is the year for better instrumentation.

  • On premises, applications are more integrated, distributed and asynchronous than ever
  • The move to the cloud is driving architectures with fine-grained modularity and scale-out across many remote machines

If you still treat logging as an afterthought, operating and debugging apps in 2015 is looking like a nightmare.

Thankfully, tools and practices are catching up. And, just as it was with requirements, builds, testing and deployment, many improvements are coming from an integrated approach to what was once “somebody else’s problem” or a siloed responsibility.

If your instrumentation isn’t all it could be, here are three suggestions to get you off to a new start this year.

1. Take another look at Structured Logs

First, a new generation of tooling has come online. Text logs from distributed apps are an ergonomic disaster, requiring complex, cumbersome tools to manipulate in all but the most trivial scenarios, so alternatives have been baking away for a long time and are finally hitting the mainstream.

In .NET, we’ve got SLAB from Microsoft Patterns and Practices, and more recently the open-source Serilog, that make structured logging as quick, easy and painless to implement as text logging (think log4net, NLog) but with miraculous advantages when it comes time to consume events for diagnostic purposes.

Unlike text logs, when you write a structured log all of the data associated with an event are kept in a structured format (think “JSON document”) that can be rendered out to a more traditional text message, but also sorted, searched and filtered just like documents in a NoSQL database might be.

What’s the difference between this (log4net):

log.Warn("Cache reached {0} items", cache.Count);

And this? (Serilog):

log.Warning ("Cache reached {CacheSize} items", cache.Count);

To write, very little – and when viewed at the console, not much either. But with appropriate storage, the structured version supports filtering with queries like:

CacheSize > 1000

… and not a regex in sight.

With structured logs you can use clean data types and familiar operators to quickly answer questions that would be time-consuming and awkward using plain text.

If you’re not using structured logs already, give this technique a try this year – it’ll change the way you look at logs for the better.

2. Use Logs to validate new Behavior

Automated tests are great – they verify that a chunk of code in isolation does what you expect. If you’re like me though, you spend a good amount of time smoke testing your work by hand, too – putting features through their paces the old fashioned way and trying to break them.

While you do this, logs are a great way to peer into the internals of an application. Sometimes, below the surface, all is not what it seems – that warning you added: "This code should only be called on even numbered years"? Well, how do you know it isn’t triggering right now? Watching each step in a process logged out clearly is a great way to understand your system better, and it really does improve the quality of the code you check in.

Think about it this way – unit tests validate your expectations, but logs will show you things you didn’t expect.

For this strategy to be effective, you need to have logs written to a log viewer on your development machine. Console terminals and text files are under-powered and quickly become a blur when things heat up. There are lots of great tools for this; our log server Seq is free for development use, or check some of the other options you can find with a quick web search. What tooling you use is a secondary consideration though – the important thing is to make feedback from logs a first-class part of your basic development process.

And, here’s the trick: while you’re using logs in this way, you’re implicitly shaping them to be useful for diagnosing issues in production. If your logs show you clearly what’s happening during development, there’s a good chance they’ll be useful later down the track too.

3. Match Issues with relevant Logs

Here’s another great strategy I’ve seen used to brilliant effect.

When features are formally tested, pipe logs from the test environment to a log server. Whenever someone raises an issue, ask them to include a link to relevant events from the log. (This will quickly validate the quality of your error messages!)

For example, if the user is raising purchase order #12345, they can search the log from the test environment for “purchase order 12345” and should get relevant results that they can link to from an issue.

Again, here’s the trick: how will the tester always find relevant events, you ask? Well – that’s a good question! When a real customer hits an issue raising a PO, you’ll need to do the same thing. This makes test-time issues a drill for the real thing – one that validates the quality of your instrumentation and improves your readiness for dealing with issues in production.

As a bonus, you’ll soon be able to link to logs for issues in the production environment, too, which is absolutely golden if you’re the developer in the hot seat.

Conclusion

That’s it for this post. Three things you can try to get your instrumentation kicked off in the right direction this year:

  • Write structured logs
  • Use them to validate behavior during development
  • Link relevant logs from your test team’s issue reports

Once we take instrumentation back into the realm of our responsibility as developers and stop just throwing it over the wall, there are lots more interesting things to consider about writing smarter, more effective logs in the first place. I’d love to hear what works for you.

Using Serilog with F# Discriminated Unions

$
0
0

Serilog

This week GitHub user vlaci called us out on awful F# support in Serilog. In their issue report they show how a nice clean discriminated union type like “Option” is represented hideously in structured data:

type Shape =
    | Circle of Radius : double
    | Rectangle of Width : double *  Height : double
    | Arc // ...
let shape = Circle 5.
Log.Information("Drawing a {@Shape}", shape)

Prints:

2015-01-14 16:52:06 [Information] Drawing a Circle { Radius: 5, Tag: 0, IsCircle:
   True, IsRectangle: False, IsArc: False }

The verbosity gets worse for types with more values.

I took this as a chance to crank up Visual Studio and get reacquainted with F#, using the example from @vlaci as a starting point. Using Serilog.Extras.FSharp you can now enjoy your discriminated unions encoded pleasantly like:

2015-01-14 16:58:31 [Information] Drawing a Circle { Radius: 5 }

Depending on the log storage you use you’ll be able to query on the tag as well as the fields (like Radius) from the union.

You can enable this by installing the package and adding Destructure.FSharpTypes() to your logger configuration:

open Serilog

[<EntryPoint>]
let main argv =

    Log.Logger <- LoggerConfiguration()
        .Destructure.FSharpTypes()
        .WriteTo.ColoredConsole()
        .CreateLogger()

    Log.Information("Drawing a {@Shape}", Circle 5.)

    0

Thanks again to vlaci for kicking this off. I was especially keen to see this in because I’m sure someone with better F# skills than mine can add a lot to the Serilog/F# experience. If you have ideas we’d love to hear from you on the project site!

Tagging log events for effective correlation

$
0
0

Correlation, at least when we’re talking diagnostic logs, is the process of finding events that are related to each other in some way. It’s typical to correlate events raised during a transaction, on a specific thread, on a machine or from steps in some kind of process.

Correlation is king in the world of operating complex, distributed and asynchronous apps: it’s how the signal is picked out of the noise – the wheat from the irrelevant chaff – the diamonds that will help you solve a critical issue from the mud of day-to-day happenings.

I gave a presentation a few weeks back at DDD Brisbane on building better apps by taking an active approach to logging. The last post should give you an idea of the flavor of it. After the talk some nice folks approached me and said I’d filled in a missing link for them – it made me realize I’ve been using a little strategy for correlation without really thinking about it, and you might find this useful too.

Contextual correlation

For a long time, diagnostic logs have incorporated contextual information into events. Context tells you what was happening when an event was raised, or where the event was raised from. In its earliest form it might be the thread ID you sometimes see formatted into text logs:

2015-01-22 10:55:05.776 INFO [22] Serving catalog index
2015-01-22 10:55:05.902 WARN [8] Query took 109 ms
2015-01-22 10:55:05.902 INFO [22] Responding with OK

The thread ID in this case is included in each log message between brackets after the level. It tells us that the warning on the second line was raised on thread 8, which isn’t the same thread as was concurrently serving the product catalog (thread 22), so the source of the warning was elsewhere.

Searching a simple text log like this we could grep for /[8]/ to see what else was happening on thread 8 and hopefully narrow down on the source of the slow query.

Serilog does contextual correlation in a few different ways.

Enrichers can be used to attach different contextual properties to events:

var log = new LoggerConfiguration()
  .Enrich.With<ThreadIdEnricher>()
   // Other config here, then…
  .CreateLogger();

Enrichers work well when the context of an event can be determined statically – i.e. it’s something ambient like the thread id, machine name, the logged-in user, and so-on.

For context that’s more localized, there’s a special enricher that can be added to enable the Log Context:

  .Enrich.FromLogContext()

Once the log context is enabled, a block of related messages can be tagged using the methods on the LogContext class:

using (LogContext.PushProperty("MessageId", GetCurrentMessageId()))
{
  Log.Information("Processing {OrderId}", message.Order.Id);

  // Later
  Log.Information("Order processing complete");
}

If we look at these logs in Seq, we’ll see an MessageId property attached to each event within the using block:

1-MessageId

This can be used as a filter, e.g. MessageId == 12345, to view the events raised when processing the message.

Contextual correlation is bread-and-butter stuff. If your application processes work asynchronously, you need to be able to filter down to a single task, and properties tagging events from a context make this as painless as possible.

It’s worth noting that contexts overlap – an event can belong to a thread as well as to a message. (This is one of the arguments for structured logs – it’s much easier to work with events with real, named properties than it is to devise readable, unambiguous ways to embed all of these into the format of a text log message.)

Setting up and using the log context does add some noise to application code, so it’s something to be used judiciously. To tag events for correlation without additional machinery, another technique is useful.

Lateral correlation

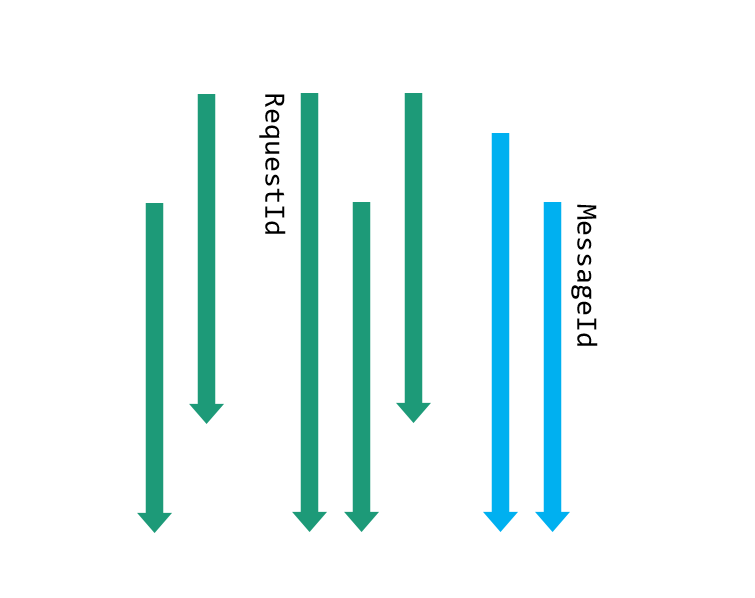
If you think about all the contexts in your running application, you might come up with a mental picture like this:

Contextual

The green lines show sequences of events tagged with the same RequestId property, while blue shows a MessageId property that might be added to events during back-end processing. There’s some simplification here, given the way contexts overlap, but essentially each context is a temporal sequence of correlated events.

When it comes time to use these logs however, scenarios frequently cross these little islands of navigability, so something else is needed.

Let’s say we’ve received an issue report tagged with an exception message. We find the exception using the text:

2-InvOrder

And then follow the MessageId contextual property to see what happened in the message handler that failed.

3-Mid

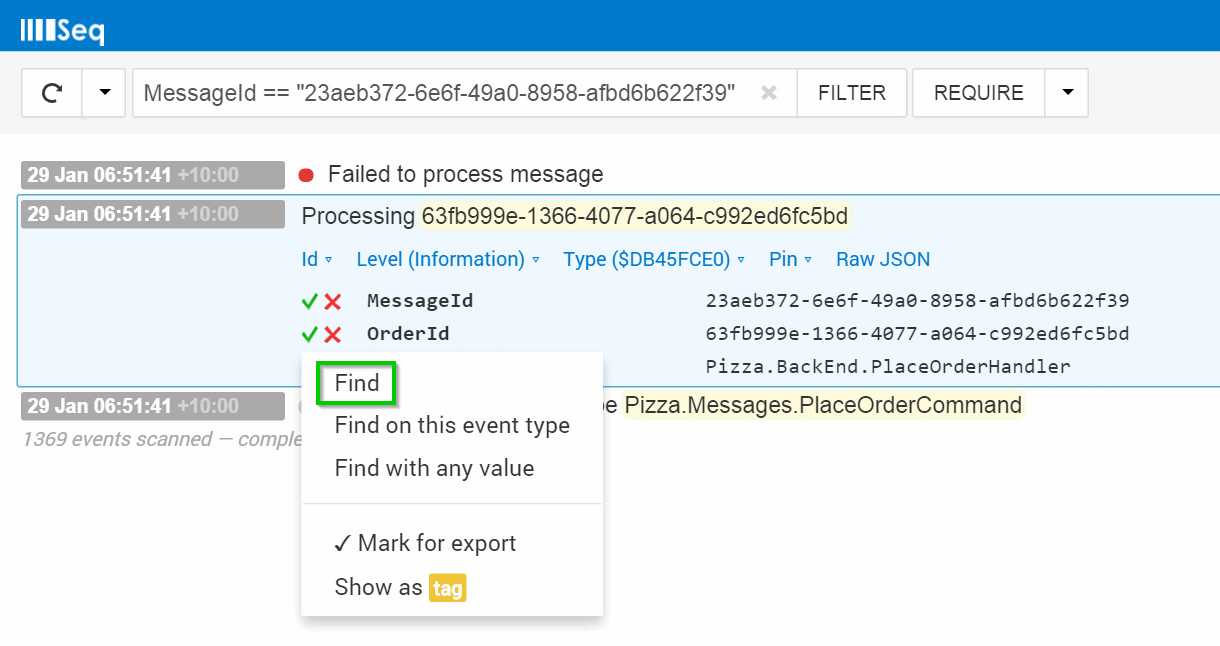
Now, we know somehow we were sent an order without any items – where did it come from? This is where a lateral correlation identifier comes in handy. The second event in the three above implements this:

Log.Information("Processing {OrderId}", message.Order.Id);

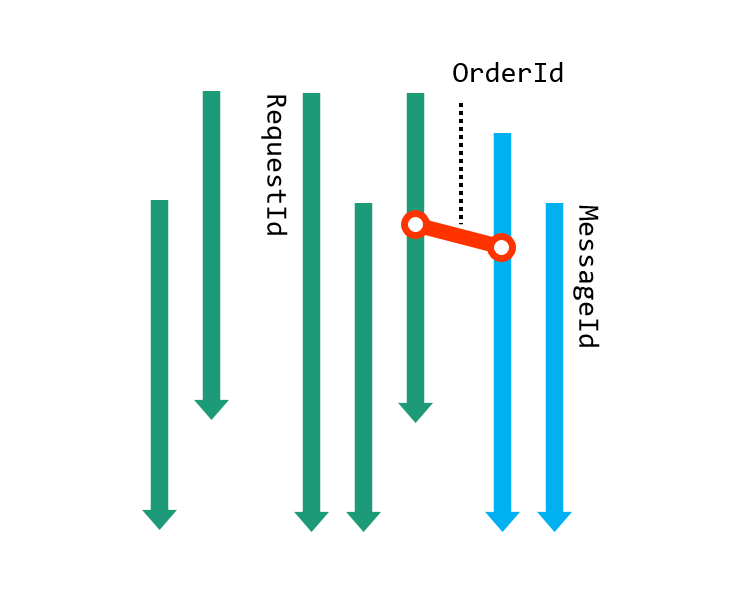
OrderId is a business-domain identifier included in the message itself that links the event across lines of causality to others related to the same order.

Once we jump across contexts using the OrderId:

4-Find

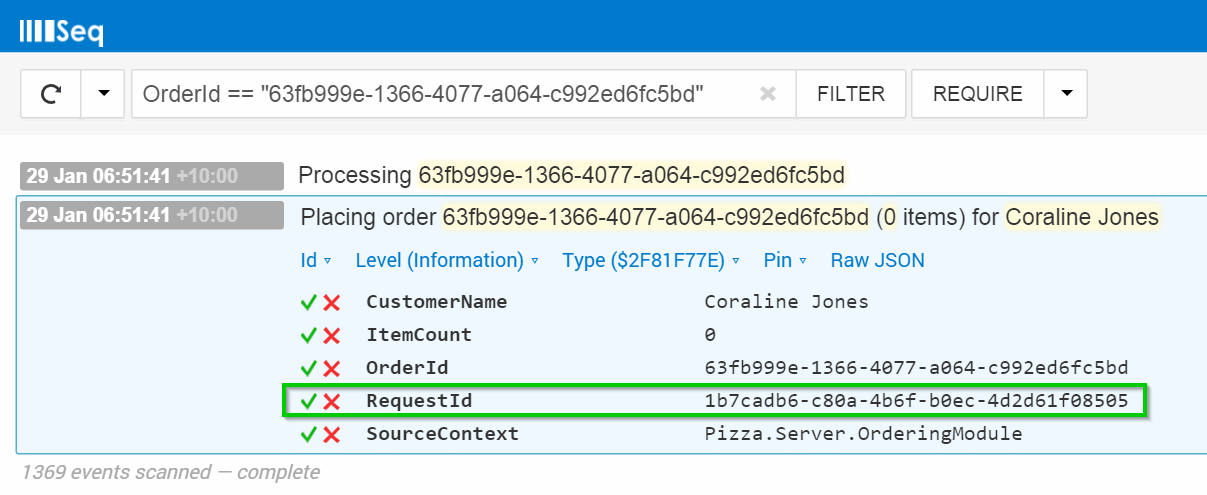
We can now see an event from the HTTP request that initiated the order.

5-Req

(A keen-eyed reader might note here that searching on ItemCount == 0 would have narrowed things down a little faster – but identifying this opportunity still requires some navigation through the logs from the point of failure too.)

Correlating by HTTP request Id we get all of the events from the request and should (on a real event stream) be able to get to the bottom of the issue:

6-Final

Patching this into our mental model, OrderId let us navigate laterally between the two sequences of events.

Lateral

Logging in two dimensions

Armed with a tool like structured logging that can easily be overused and create clutter, the last thing anyone wants to do is bung every possible property onto every event in an attempt ease diagnostics later on.

Keeping a clear distinction between the contextual and lateral correlation links makes it possible to navigate effectively through events raised by the app with a minimum of syntactic noise.

It turns out that in most situations I’ve encountered, architectural and infrastructural concerns dominate the notion of context. HTTP request id, thread id, message id – these are all mechanical concerns that get buried into plumbing and attached using enrichers or the log context. This is pretty convenient – the noisier APIs for adding contextual properties are best kept in infrastructural code when possible.

Identifiers from the business domain provide lateral navigation through logs – customer ids, order ids and the like – letting you skip between the various contexts in which an entity was referenced. Using structured logging these links can be created without much fanfare – just logging an event with the identifier in its message text is enough to make the connection.

It’s a simple perspective that helps me use structured logs more effectively, and it can be a nice foundation for guidelines shared with a team. If you use this strategy already, or another similar one, I’d love to hear more about your experiences!

C# 6 string interpolation and Serilog

$
0
0

It’s easy to spot the similarity between Serilog message templates:

// Serilog
var loggedInUserId = "nblumhardt";
Log.Information("Logged in {UserId}", loggedInUserId);

and C# 6 interpolated strings:

// C# 6
Log.Information($"Logged in {loggedInUserId}");

This is naturally because of their shared common ancestor, the .NET format string. Under the hood, interpolated strings in C# are converted by the compiler into a struct with the classic format string and argument values, logically along the lines of:

// C# 6 desugared
Log.Information(new FormattableString
  {
    Format = "Logged in {0}",
    Args = new object[] { loggedInUserId }
  });

The similarity has led a few of us, since seeing the new C# feature, to wonder whether a few keystrokes might be shaved off of the Serilog API if only the C# compiler would preserve the names of the “holes” in the interpolated string, i.e. loggedInUserId in this example.

There was initially mention of Serilog on the design thread for the feature, and more recently Andrey Shchekin most graciously raised a ticket on the Roslyn issue tracker as a prompt for some support in C# 7.

I’ve had some time to think about this feature now, and while the concision is appealing, I’m no longer convinced string interpolation (name preservation or not) is a good fit for Serilog.

1. A good variable name is not necessarily a good property name

Let’s take the example above; in our hypothetical C# 6 example the complete snippet would look like:

var loggedInUserId = "nblumhardt";
Log.Information($"Logged in {loggedInUserId}");

The variable name loggedInUserId obviously reflects what this value is being used for by the program. But, if that name was carried through to the log event, e.g.:

{ { "Properties": { "loggedInUserId": "nblumhardt",

This would lead us to query the log with filters like:

loggedInUserId == "nblumhardt"

Fine if we only want to find events where the user was logged in, but in the context of a larger and more complex application, we’ll often want to find as many events as possible that are related to a specific user (who might be having some technical trouble!).

In that case, a more general property name is a better fit:

Log.Information("Logged in {UserId}", loggedInUserId);

// Elsewhere
Log.Information("Password for {UserId} successfully changed", loggedInUserId);

This small change allows us to query UserId == "nblumhardt" and find both matching events.

Log event property names are important enough for diagnostics that they deserve their own identity, separate from the variable names around them.

2. Holes don’t always have obvious names

What does the property name for this statement look like?

Log.Information($"Enabling categories {new[]{1, 2, 3}}");

Here the hole is filled with an expression that’s not a simple name, so some kind of munging would be necessary in order to turn it into a valid log event property name (a JSON identifier or similar).

Going down this path would definitely reduce the overall quality of log events, and elevating log events to first-class status is what Serilog’s all about.

So what’s the relationship between Serilog and C# 6, then?

String interpolation is a great feature, one I’ve looked forward to in C# for a long time. The idea of providing direct support for Serilog is a very interesting one and worth exploring, but I’m increasingly convinced it’s unnecessary.

Interpolation is nice when it keeps code DRY, cutting out the redundant clutter of {0} and {1} and preventing parameter mismatches.

In the case of Serilog, I think it’s incorrect to consider the property names like {UserId} as redundant; in a well-implemented logging strategy they’re an incredibly important part of the picture that deserve their own consideration. You wouldn’t let variable names determine the table and column names in a relational database – it’s exactly the same trade-off being considered here.

What do you think? I’d love to be convinced there’s more synergy to be found here, but I’m not seeing it at present.

A Monster Serilog Update for April 2015

$
0
0

Serilog is an open-source logging framework for .NET that seamlessly integrates text-based logging and fully-structured events. You can write events to regular text files, or use Serilog in combination with a structured log server for the easiest log filtering and navigation on the planet!

TL;DR we’ve been busy – Serilog 1.5 is out with new external configuration support; the project has been reorganized; and if you’re in Portland next week you can learn more about Serilog at .NET/FRINGE/.

First up: 1.5 is live!

Serilog 1.4 has been a long-lived and stable release. In fact, well over half of Serilog’s 69,304 downloads have been of the 1.4 series!

Update-Package Serilog

Well – we hope it’s been worth the wait: you can now pick up Serilog 1.5.1 hot off the NuGet press :-)

What’s new? Core support for external configuration sources.

The feature responsible for a minor-version bump is integrated “external settings” support.

Serilog was, is, and always will remain a primarily code-driven library. For a long while however the project offered a simple <appSettings>-based configuration option that could be used to specify the minimum logging level, enriching properties, and sink parameters in XML App.config and Web.config files.

We found this package, Serilog.Extras.AppSettings, popular and useful enough in practice that some support for this functionality in the core is warranted.

If you install the Serilog package into a .NET project with XML configuration support, you can now use the .ReadFrom.AppSettings() method to pull logger configuration directly from an XML configuration file:

var log = new LoggerConfiguration()
  .ReadFrom.AppSettings()
  .WriteTo.ColoredConsole()
  .CreateLogger();

XML configuration is very simple and relies on the <appSettings> element found in standard config files:

<?xml version="1.0" encoding="utf-8" ?>
<configuration>
  <appSettings>
    <add key="serilog:minimum-level" value="Debug" />
    <add key="serilog:write-to:File.path" value="C:\ProgramData\MyApp\my-log.txt" />
    <add key="serilog:enrich:with-property:MachineName" value="%COMPUTERNAME%" />
  </appSettings>
</configuration>

But, we haven’t simply shoehorned the old “extras” package into the core. Serilog’s new configuration support is open and will be fitted to the new ASP.NET 5 configuration system when it’s finalized. There’s already a simple key-value pair setting implementation, .ReadFrom.KeyValuePairs(), that you may find useful if XML isn’t your style.

You can read more about using this feature in the documentation.

New Community Projects

Though the split has been in progress for some time, 1.5 marks the end of a big push from Serilog’s core contributors to break out many of the useful “extras” projects into their own top-level organisations and repositories.

Michiel van Oudheusden led the charge with SerilogMetrics, a Metrics.NET-inspired project that adds timer, gauge, and counter features on top of Serilog. This replaces the original Serilog.Extras.Timing package.

serilog-metrics-256

Destructurama! makes Serilog able to accurately serialize exotic things like F# discriminated unions, or JSON.NET dynamic objects. These packages replace their earlier versions that were contributed and baked as “extras”.

Finally, consistent support for logging web application requests is the goal of the SerilogWeb project. Currently the ASP.NET and OWIN support libraries have moved over, and I have high hopes for these finding some interesting synergy with an ASP.NET 5 integration there when the time comes.

If you’re building something that adds to Serilog, let us know – we’d love to list you on the community projects wiki page we’re maintaining for this purpose.

The Great Sink Split

We’ve bunkered down to make sure Serilog “the project” stays lean and healthy. It’s easy for open source projects that integrate with many technologies to grow and sprawl, and as it evolved Serilog hit nearly fifty interrelated projects in its core solution.

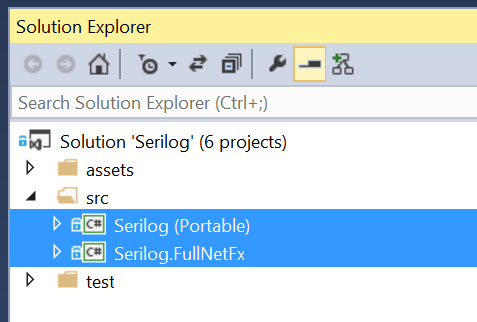
Starting from Serilog 1.5, all of the various provided sinks live in standalone GitHub repositories. Hat tip to Matthew Erbs for helping push this huge task to completion! Combined with the move to establish our new community projects, this brings the Serilog solution itself back to a pair of projects – the portable core, and additional full .NET framework support.

SolutionExplorer

The 1.x series of releases is slowing down, but we’re making sure that we have the right project structure for Serilog to stay fresh and current well into the future.

Who contributed to this release?

We now count 57 individuals on our contributors page. This number isn’t an accurate representation any longer since new (sink) code now lives outside the Serilog repository, so there are even more wonderful folk not listed here.

Anything else?

Yes!!! If you’re lucky enough to have a ticket Daniel Plaisted will be speaking on Serilog at .NET/FRINGE/ next Monday, 13th April in Portland, OR.

DotNetFringe

The conference is about breaking the rules and pushing the boundaries of .NET, so I’m especially excited to hear Daniel will be presenting Serilog there.

Serilog 1.5 is now on NuGet, go get it!


serilog-generator.exe and fun with key-value settings

$
0
0

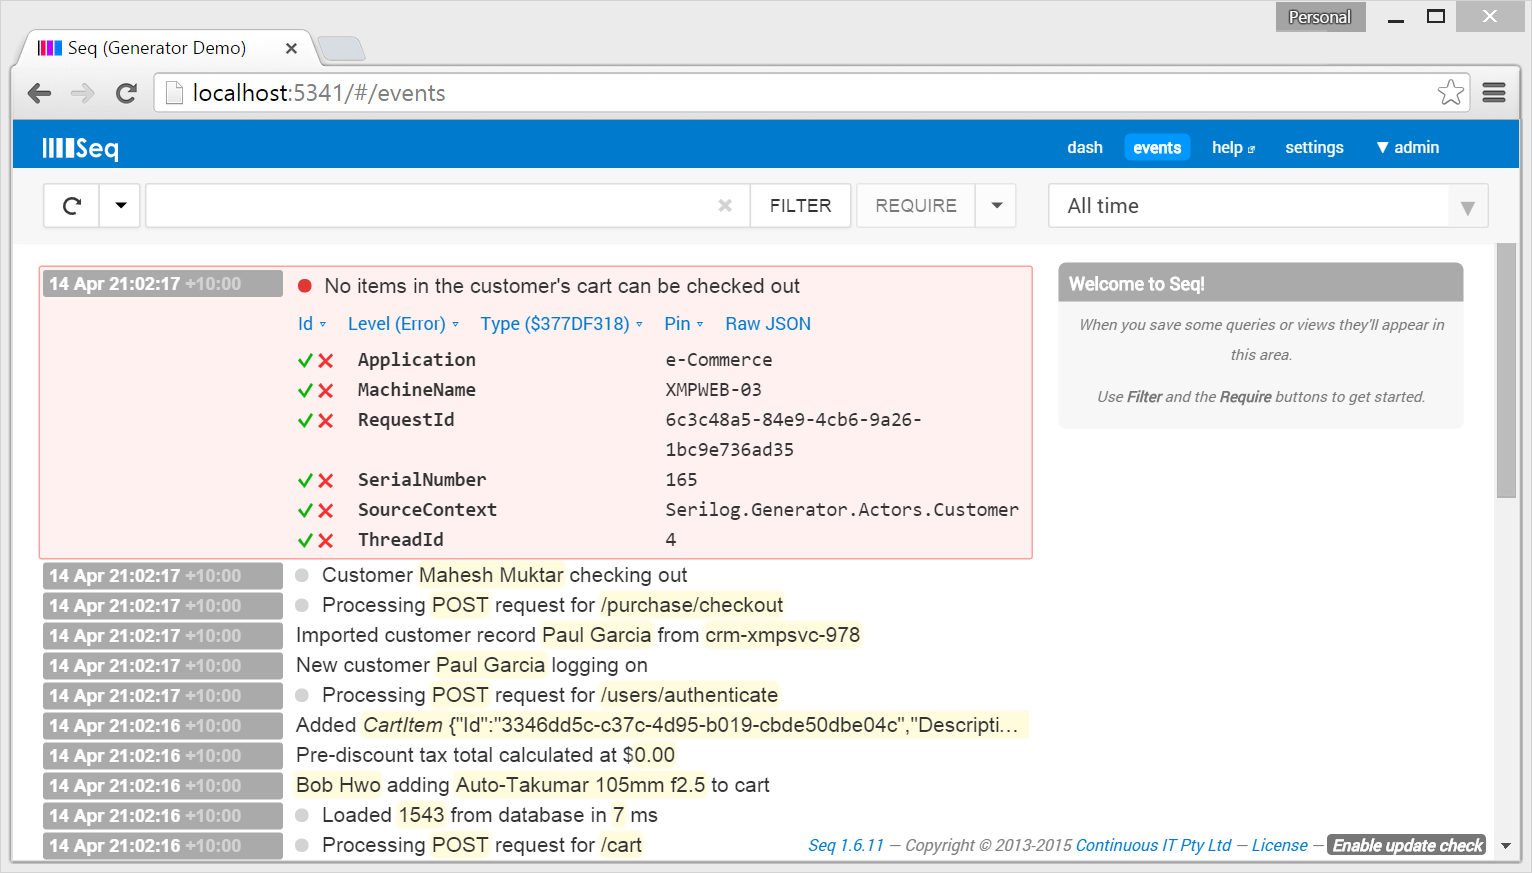
Some things are just fun to build, and without much concern for its general utility I thought I’d share one of them :-)

serilog-generator.exe is a handy little app for exercising Serilog sinks and log servers without needing a test harness project for each one. It’s published on NuGet as a ‘tools’ package and can be installed into a sink project like any other NuGet package:

Install-Package serilog-generator

(It’s also on Chocolatey but currently fails because of some command-line handling that Chocolatey shims seem to do.)

At a command prompt in a folder containing a Serilog sink assembly, the sink can be loaded, configured, and sample data pushed through it with a command-line like this one that exercises the Seq sink:

serilog-generator --using="Serilog.Sinks.Seq" --write-to:Seq.serverUrl="http://localhost:5341"

Unless --quiet is specified, the log will also be written to the console so you can compare it with what shows up in your sink:

Generator

You might have noticed that the command-line syntax for configuring the sink is very similar to the <appSettings> format supported by Serilog 1.5. Compare the command-line above with:

<appSettings>
  <add key="serilog:using" value="Serilog.Sinks.Seq" />
  <add key="serilog:write-to:Seq.serverUrl" value="http://localhost:5341" />
</appSettings>

The XML version uses a serilog: prefix to disambiguate from other settings often found in config files, but apart from that you can see the basic using/write-to directives (as well as the minimum-level and enrich options not shown here) work the same way.

That’s because the underlying Serilog configuration support is key-value based, not specific to XML settings files. You can read Serilog configuration from any medium that can represent key-value pairs.

Adding a new configuration provider is as easy as finding a way to load the pairs:

var pairs = new Dictionary<string, string>
{
  { "using", "Serilog.Sinks.Seq" },
  { "write-to:Seq.serverUrl", "http://localhost:5341" }
});

Log.Logger = new LoggerConfiguration()
  .ReadFrom.KeyValuePairs(pairs)
  .CreateLogger();

You can see how serilog-generator.exe uses this general support to implement ReadFrom.CommandLine() in its source. There are a couple of subtle points in there but it’s really only a few lines of code.

Reading settings from the command-line might not be particularly useful for many (most!) apps, but if you’re using a different configuration system and want to tap into Serilog’s built-in settings support it can come together quite smoothly.

Seq/2 Update

$
0
0

When I started building Seq nearly two years ago, I expected it would be used occasionally – after all, chasing bugs in production systems isn’t something we set out to do every day :-)

The first time I visited one of our larger customers on-site, I’d hoped to sneak a glimpse of someone using Seq as I walked through the office. I was in for a bit of a surprise; not only did I spot it running on nearly all developers’ “second” monitors, the QA team had a Seq session open and were collecting up exception information for a bug report when I passed by too!

Watching people use Seq, and using it myself, I’ve come to realize that effective instrumentation begins right up front during development, just like effective testing does. Using your logs during development is the only way to make sure they’re in tip-top shape for the occasional production (mis)adventure, and in the process you can get a much clearer picture of the inner workings of a system.

The net result is that many of us use Seq every day. That puts the bar for usability very high – when you spend a lot of time with an application, ergonomics really matter. Although there are literally thousands of opportunities to expand the product in its next major version, the first priority of Seq/2 is to make the user experience as delightful as it can be.

Seq2PreAlpha

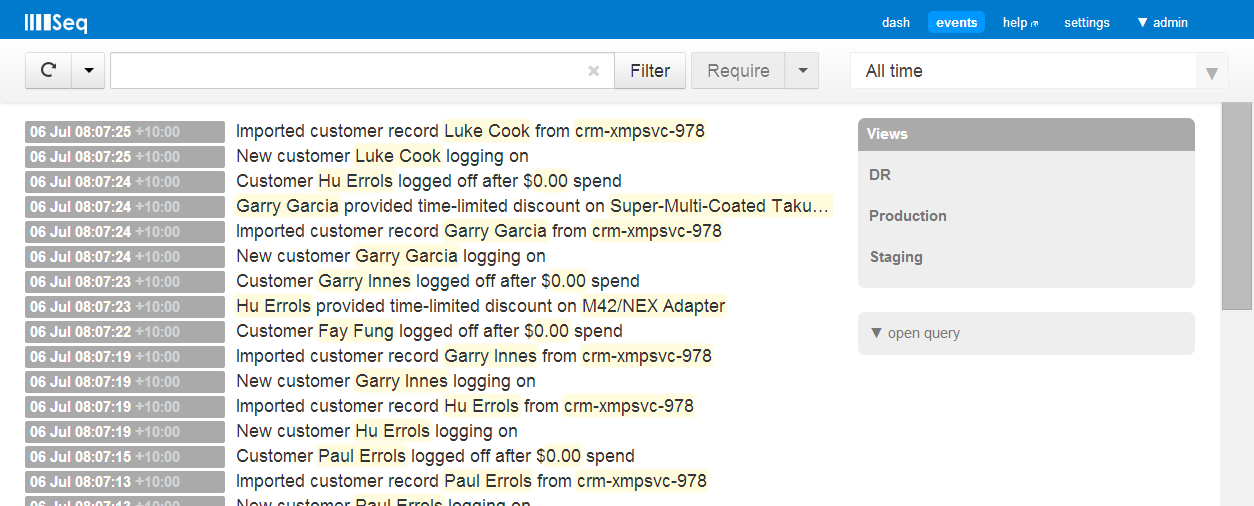
What does ‘delightful’ actually mean? We’ve reviewed and refined nearly every corner of the Seq user interface in the second version. On the events screen, where the “real work” gets done, you’ll find:

  • Queries and views are being merged into a single “signal” concept, which greatly simplifies working with them
  • Combining the filters from multiple signals is as easy as clicking each one to select it
  • Each user maintains their own view of the available signals in the system – signals created by other users are added explicitly
  • It’s easy to create a CSV export from all of the currently tagged properties
  • Property and built-in function names are auto-completed in the filter bar (ooooooh!)
  • Filter syntax help is shown under the filter box when an expression isn’t recognized
  • The interface is much friendlier towards touch devices
  • Date/time range selection is getting a big usability boost
  • Oh, and it’s now much easier to select text from log messages

Of these, we think signals are going to have the most impact; you can already see the simplifications they offer flowing through into the much cleaner (and now full-width!) filter bar. Many other changes are paving the way for exciting things we plan to introduce later in the 2.x series.

Work has been progressing steadily on the new version for several months, and we’re starting to get a better feel for the release date. If all goes smoothly we’ll ship a private alpha to interested users in the next month or so, followed by a public beta nearer the end of June. In the meantime I’m hoping I’ll have a chance to write more about the new version and what else you can expect from Seq this year.

If you’d like to participate in the 2.0 alpha, please sign up for the Seq newsletter via the footer of our homepage; we’ll be continuing to provide monthly updates through that channel. Cheers!

Diagnostic logging in DNX/ASP.NET 5

$
0
0

If you’re writing ASP.NET apps with the latest tooling, you will inevitably encounter the Microsoft.Framework.Logging package. It’s a dependency of ASP.NET MVC, WebForms and much of the related infrastructure. “What is this thing?” you ask. Great question!

The Framework writes log events

When an MVC controller is selected, when a static file is served, when an error is caught… ASP.NET and other framework libraries helpfully log this information.

In past .NET versions, System.Diagnostics.Trace was the output of choice, but the world has moved on and the newer package is an alternative with a more modern-feeling API.

What does it look like?

Like ASP.NET 5, your applications and libraries can write events to the framework’s logging pipeline:

var loggerFactory = new LoggerFactory().AddConsole();
var logger = loggerFactory.CreateLogger(typeof(Program).FullName);

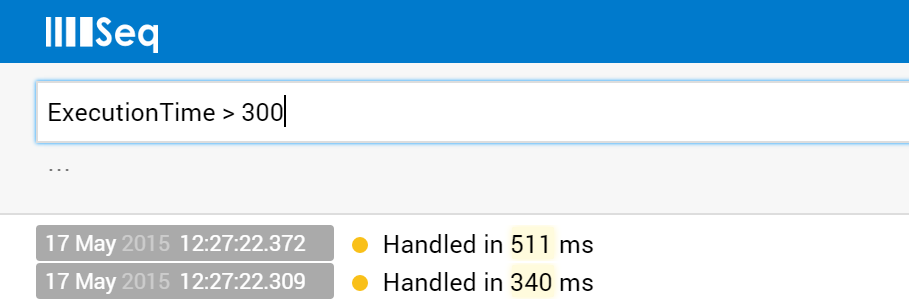
logger.LogInformation("Handled in {ExecutionTime} ms", executionTime);

An ILoggerFactory creates ILoggers, and these provide the typical methods you’d expect for logging errors, warnings, debug events and so-on.

You might be surprised (or, you might not!) that just like Serilog, Microsoft.Framework.Logging supports {Named} holes in its format strings, in addition to the typical {0} and {1}. This technique enables structured loggers to provide first-class search operations on not just the raw text of the log message, but the individual property values as well:

Execution Time gt 300 ms

The great thing is that if you’re not using a structured approach, messages will just come through the pipeline as strings – everyone’s looked after.

Microsoft.Framework.Logging vs. Serilog, NLog, SLAB, log4net…

The designers of ASP.NET faced the same dilemma as other library authors in .NET: which logging library should they use to write events? The choice of logger is typically one the application author will make, so frameworks and libraries need a way to support more than one option.

Over time we’ve had a few solutions to this – Common.Logging has been popular, and more recently LibLog does a good of providing a dependency-free API on top of several loggers.

Microsoft.Framework.Logging today is another of these, though it’s somewhat more capable (and in many ways it’s a very nice one).

Although out-of-the-box implementations are provided for basic console logging and a few other targets, you’ll need a logging back-end like Serilog or NLog to gain the kind of functionality expected by non-trivial apps.

So, how does that work?

Getting started

We’ll assume you want to use Serilog. (Instructions for NLog are pretty similar, and an example that uses it can be found here.) The ASP.NET Team wrote the original Serilog back-end for Microsoft.Framework.Logging, and transferred it to the Serilog project where it’s currently supported and maintained.

First, install the Serilog.Framework.Logging NuGet packag into your web or console app.

Next, in your application’s Startup() method, configure Serilog first:

using Serilog;

public class Startup
{
  public Startup(IHostingEnvironment env)
  {
    Log.Logger = new LoggerConfiguration()
#if DNXCORE50
      .WriteTo.TextWriter(Console.Out)
#else
      .WriteTo.Trace()
#endif
      .CreateLogger();
     
    // Other startup code

The conditional compilation (#if) is necessary if you’re targeting the CoreCLR runtime, for which there are currently few Serilog sinks. If you’re targeting the full .NET framework you can just use .WriteTo.Trace(), or any other available sink.

Finally, in your Startup class’s Configure() method, call AddSerilog() on the provided loggerFactory.

  public void Configure(IApplicationBuilder app, IHostingEnvironment env,
                        ILoggerFactory loggerfactory)
  {
      loggerfactory.AddSerilog();

That’s it! With the level bumped up a little you should see log output like:

2015-05-15 22:14:44.646 +10:00 [Debug] RouteCollection.RouteAsync
    Routes:
        Microsoft.AspNet.Mvc.Routing.AttributeRoute
        {controller=Home}/{action=Index}/{id?}
    Handled? True
2015-05-15 22:14:44.647 +10:00 [Debug] RouterMiddleware.Invoke
    Handled? True
2015-05-15 22:14:45.706 +10:00 [Debug] /lib/jquery/jquery.js not modified
2015-05-15 22:14:45.706 +10:00 [Debug] /css/site.css not modified
2015-05-15 22:14:45.741 +10:00 [Debug] Handled. Status code: 304 File: /css/site.css

An important note on levels

If you want to get more or less information from the log you’ll need to change the level.

  • You need to set MinimumLevel on both the Serilog LoggerConfiguration and the ILoggerFactory
  • Serilog and ASP.NET assign different priorities to the Debug and Trace levels; Serilog’s Debug is ASP.NET’s Trace, and vice-versa

Which API should my application use?

Personally, I’m content to let ASP.NET write events with the Microsoft.Framework.Logging API, and to use Serilog’s native API in my application code. The designers of the framework API have gone out of their way to support a wide range of logging styles, so using either is reasonable. I’m obviously somewhat biased, but I prefer the more focused API of Serilog to the more general one from the framework. Your preferences might differ :-).

The important thing is – don’t miss the opportunity posed by ASP.NET 5 to take your logging to the next level and get some structured events through your logging pipeline.

Getting help

If you have questions or comments please feel free to raise an issue on the tracker. We’re also frequently in the Serilog Jabbr chat and happy to help if you get stuck!

Seq/2 Beta

$
0
0

Last month I posted the first sneak peek of what you can expect from the upcoming Seq “v2″ release.

Since then, the final pieces of the UI have been put (back!) into place, bugs have been squashed, and we’ve incorporated feedback from some helpful early adopters.

Today, though there remains plenty to do, we’re ready to open up the beta to a wider audience. You can now download the latest installer from the Seq homepage.

Timeline

Shown above is the fledgling “Timeline” view, that displays the distribution of matches for any Seq query inline.

What’s inside?

Recapping from the earlier post, the new release is strongly focused on user experience, both by simplifying the UI and underlying model, as well as improving common scenarios and considering the needs of larger projects and teams.

A few of the more noticeable differences:

  • The UI is much more responsive in basic scenarios
  • Queries and views have been combined into a much simpler and more powerful “signal” concept
  • Each user gets their own view of the available signals in the system – signals created by other users can be added explicitly
  • Property and built-in function names are auto-completed in the filter bar
  • Filter syntax help is shown under the filter box when an expression isn’t recognized
  • The interface is much friendlier towards touch devices
  • The dash layout is more compact, getting more info onto the screen in a more useful format
  • Filtering by date and time is easier
  • You can see the distribution of events across a time span without adding a dash item
  • It’s simpler to create a CSV export from all of the currently tagged properties (no more “Properties of Interest”)
  • Oh, and it’s now much easier to select text from log messages

A lot of small bugs and annoyances have been fixed too, and the theme updated to be clearer and more consistent throughout the settings screens.

Installing Seq/2

The goal of the beta release is to get your feedback, and from that angle we’d love you to install it. Here’s what you need to know first.

Stability

The current release is a beta. It’s not perfect – we wouldn’t recommend upgrading critical servers just yet – but it’s usable enough for real-world installations.

Bug reports are greatly appreciated – you can post those on the issue tracker or email us at our support address. Some known issues are listed below as well.

Licenses

As before, Seq/2 comes with a free single-user license that you can use out of the box.

If you’ve purchased Seq in the last twelve months, your license will cover your upgrade to version 2 for free; just go right ahead.

If you have an older license, or just want to try Seq for the first time, you can grab a trial key from the Seq website or contact our support address for help.

Known issues

At the time of writing:

  • The date/time pickers in the timeline view don’t show popup calendars
  • Substantial problems have been reported when using Google Chrome “Canary”
  • Manual event deletion is not available
  • Deep linking into a missing/deleted signal will leave the UI stalled
  • The API client has not been updated to the latest version

What’s next?

We’re hard at work to put the finishing touches on the final version. We plan to post another beta in the next week or two, and at present we’re aiming for a mid-year release.

Thanks for your help – go get it! :-)

Filtering with Signals in Seq 2

$
0
0

Structured logs are designed for easy filtering and correlation. If you monitor apps in multiple environments for example, you’ll pretty quickly turn to structured properties like Environment as a way to distinguish between logs from different locations:

Log.Logger = new LoggerConfiguration()
  .Enrich.WithProperty("Environment", "Production")
  // Other configuration, then...
  .CreateLogger();

When you collect and view these logs with Seq, you might end up writing the filter Environment == "Production" a lot.

Signals-1

Instead of typing this a hundred and twenty times a day, Seq 2 lets you save your filter as a signal. Press the “move to signal” (») button in the filter bar, and one will be created for you:

Signals-2

It’s easy to build up more complex filters by adding them to the signal with ».

The various “exclude” options on event properties and types makes it quick to eliminate noise:

Signals-3

Once you’ve given the signal a name, saved, and closed it, you’ll see it in the signal list ready to activate at the click of a mouse:

Signals-4

(Here’s where Signals in Seq 2 start to shine – to apply multiple signals like “Production” and “Errors”, just click to apply each one, and only events matching all of the applied signals will be displayed.)

Signals are really fundamental to Seq, so busy teams quickly create a lot. To see the list of signals everyone has created, and add them to your own view, use the Create or add signal… link to search the list:

Signals-5

There’s a fresh beta build now available so you can get started with Seq 2. It’d be great to have your feedback as we work through the beta process – please feel free to post here, contact our support address or raise tickets on our issue tracker.

Viewing all 102 articles
Browse latest View live